Mixing Programming Languages
One of Polynote's most interesting features is its support for polyglot notebooks, where cells within the same notebook can be written in different languages.
Variables can also be shared across languages, as all execution is done within a single process.
Execution state in Polynote
We hinted previously that the way Polynote handles cell execution is a little special.
As a reminder, the kernel keeps track of all the symbols defined by a cell execution. These symbols are part of the cell's state, which is made available to downstream cells (those below the cell in question) when they in turn are executed.
Polynote stores these symbols, alongside their types and other information, in a Scala-based format. Symbols defined by and provided to other languages are wrapped (and unwrapped) appropriately.
For more details, how this works under the hood, examples of going from Python to Scala, and information about its limitations and caveats, check out the Python documentation.
Polyglot example
Continuing our example notebook from before, here's a trivial example (note that the bottom cell has Python selected in the language drop-down).
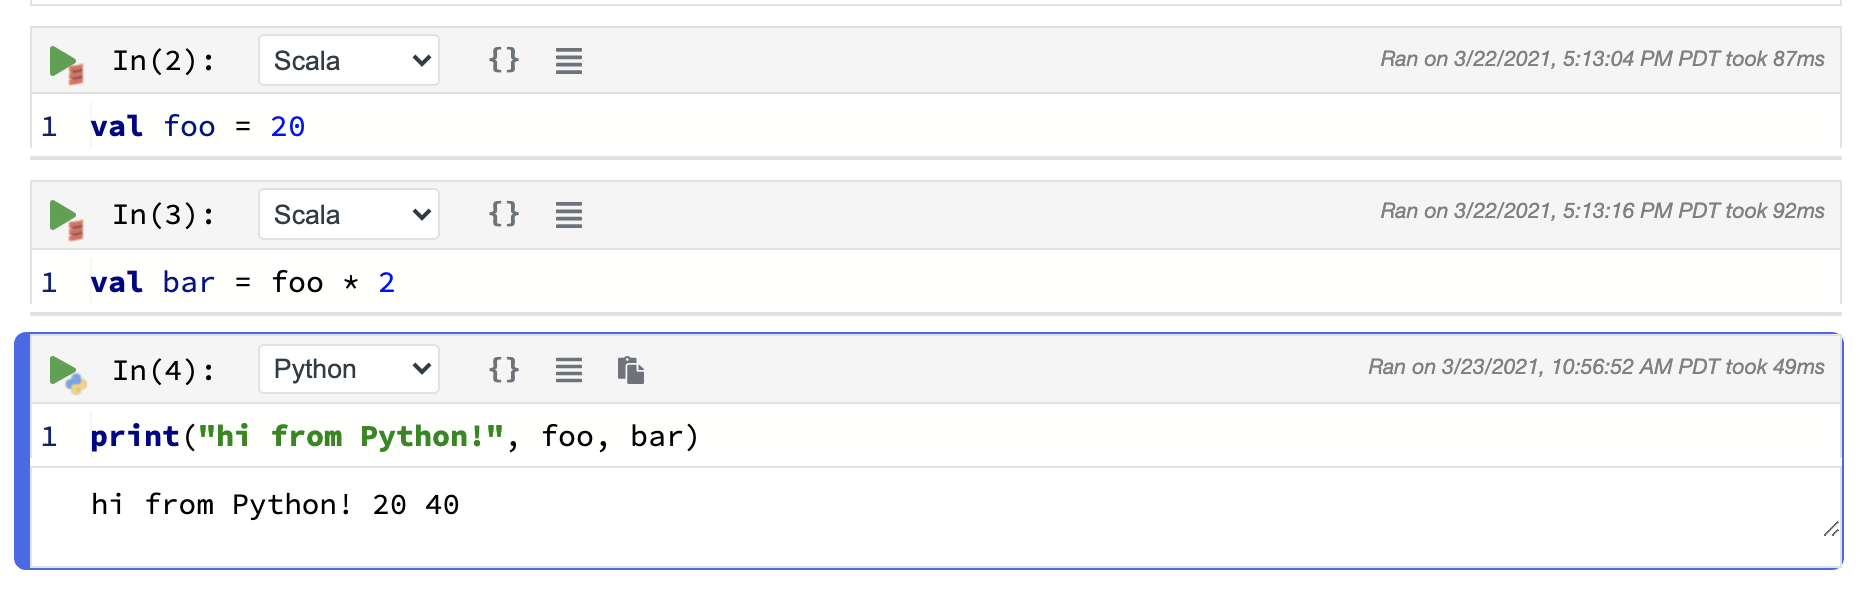
The foo and bar Scala variables can be accessed directly in Python, because they represent primitive
types (Ints in this case). This also works the other way 'round, from Python to Scala, in much the same way.
Use Case: Plotting Scala data with Matplotlib
Real-world usage at Netflix
This example notebook illustrates a contrived version of a common use-case at Netflix. Our recommendation and personalization infrastructure is heavily JVM-based, and Algorithm Engineers and Scientists want to interface with our platform in order to, for example:
- transform data in a type-safe way using Scala
- access Model Lifecycle data
- generate features based on online data snapshots
Once they get the data, they'd like to analyze and visualize it using the Python tools they are familiar with, such as pandas and matplotlib.
A more complex example of a more typical usage can be found in the examples/ folder in
Plotting Scala data with Matplotlib.ipynb
which is reproduced below.
We'll go over this example in detail.
A direct approach using primitives
This notebook takes a direct approach to polyglot development. By crossing language boundaries using primitive data structures, you don't need to worry about the details of language-specific data structures or implementations.
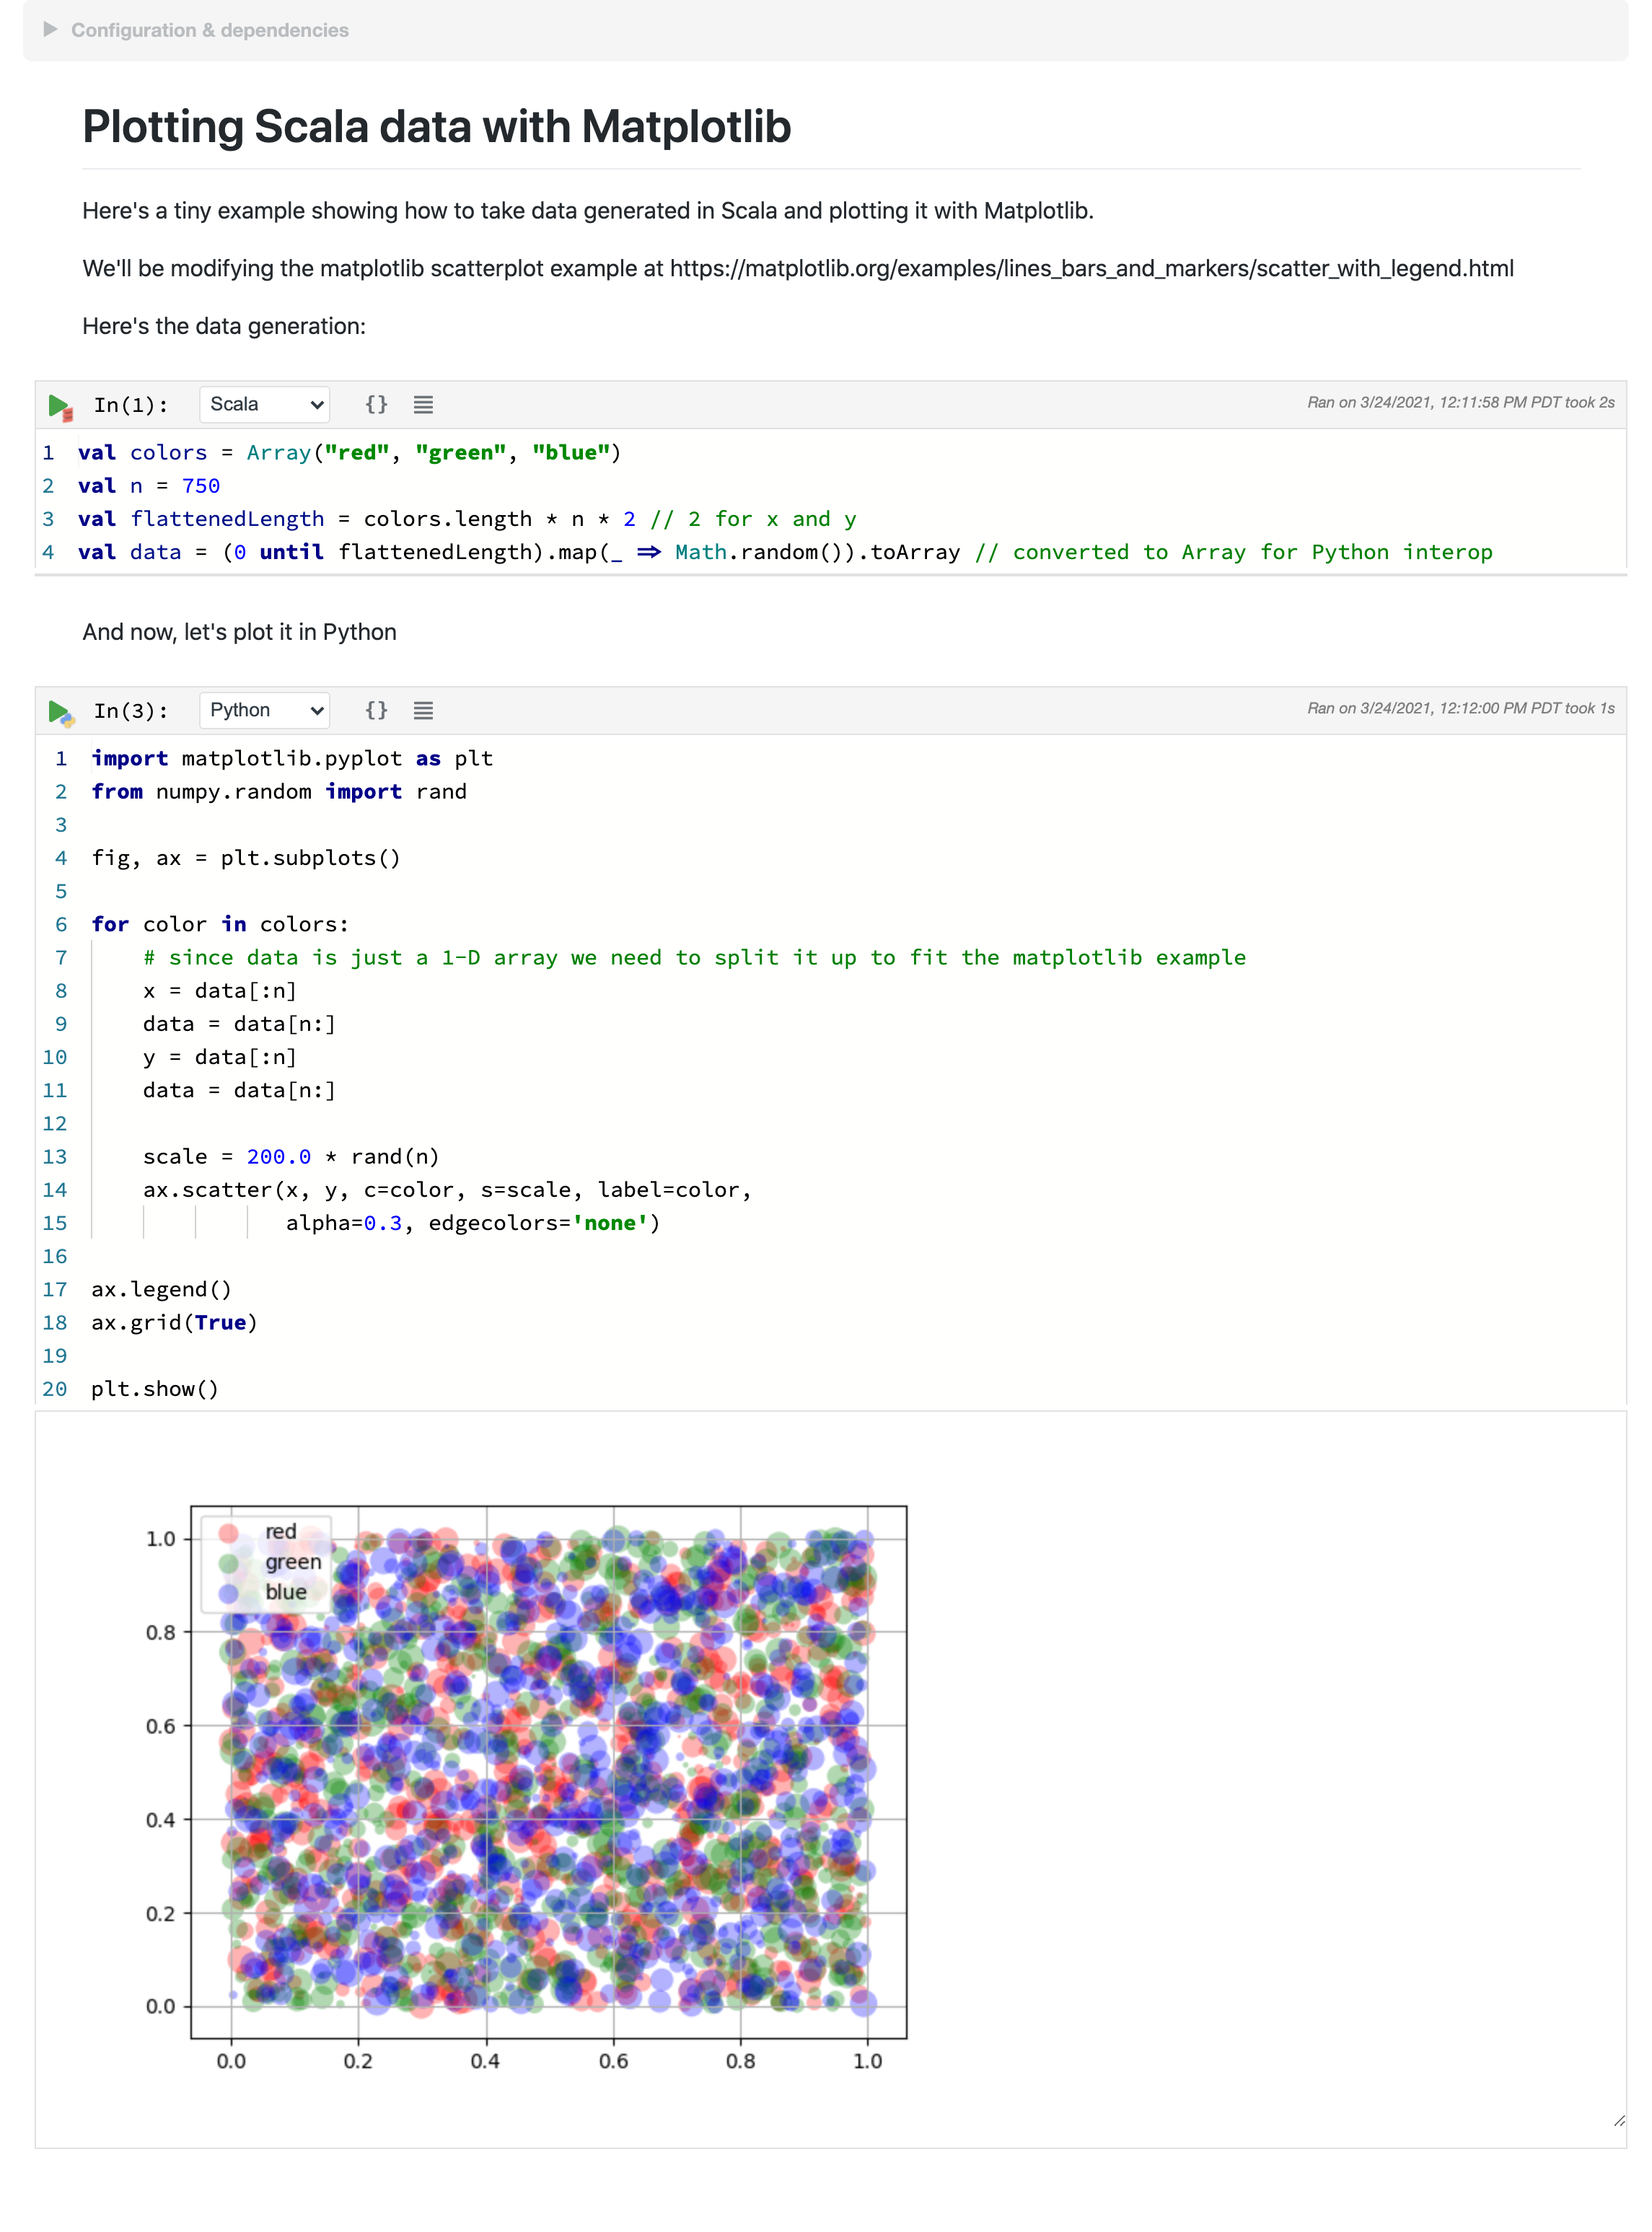
Let's go over this notebook, which consists of two cells. The first, a Scala cell, prepares some data, while the second, a Python cell, plots it.
Scala cell
val colors = Array("red", "green", "blue")
val n = 750
val flattenedLength = colors.length * n * 2 // 2 for x and y
val data = (0 until flattenedLength).map(_ => Math.random()).toArray // converted to Array for Python interop
This cell generates an Array[Double] that is a flattened representation of data in three dimensions - color,
x, and y.
This data is then fed into the Python cell to be plotted:
Python cell
import matplotlib.pyplot as plt
from numpy.random import rand

fig, ax = plt.subplots()

for color in colors:
    # since data is just a 1-D array we need to split it up to fit the matplotlib example
    x = data[:n]
    data = data[n:]
    y = data[:n]
    data = data[n:]

    scale = 200.0 * rand(n)
    ax.scatter(x, y, c=color, s=scale, label=color,
               alpha=0.3, edgecolors='none')

ax.legend()
ax.grid(True)

plt.show()
This cell steps through the data array and, for each color, unflattens the x and y data for plotting (note that
both data and color are Scala variables accessed directly from Python).
Can we do better?
This is pretty straightforward, but you might have noticed that the interchange values between the two languages are
Arrays, rather than the more idiomatic (for Scala) Seqs. You might also notice that it was pretty
unnatural to flatten data like we did.
The reason for this is that it's easier to interchange between Scala and Python using primitives and basic structures like Arrays.
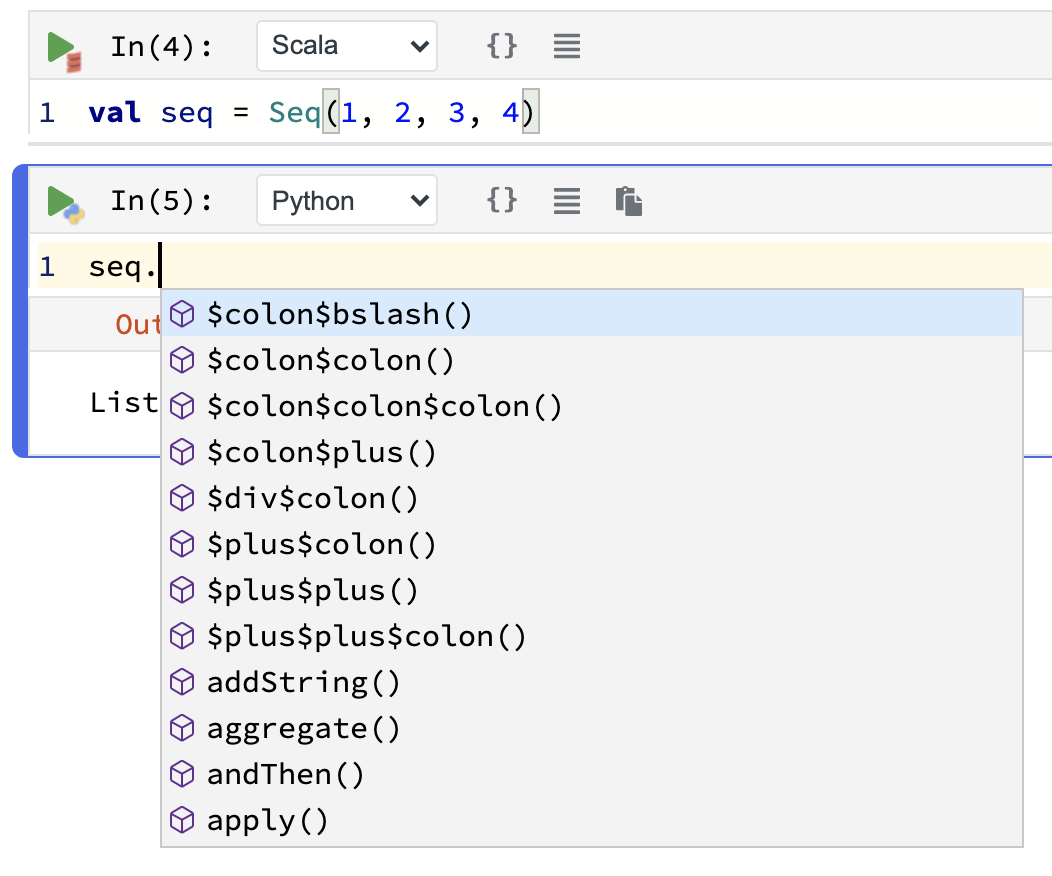
You might not realize it, but when you work with Scala there's all sorts of stuff going on behind the scenes,
such as implicits, or encoded Java method names (like $colon$colon()).
Python doesn't know about this, so when we interact with a Scala object from Python we see it in all its gory details:
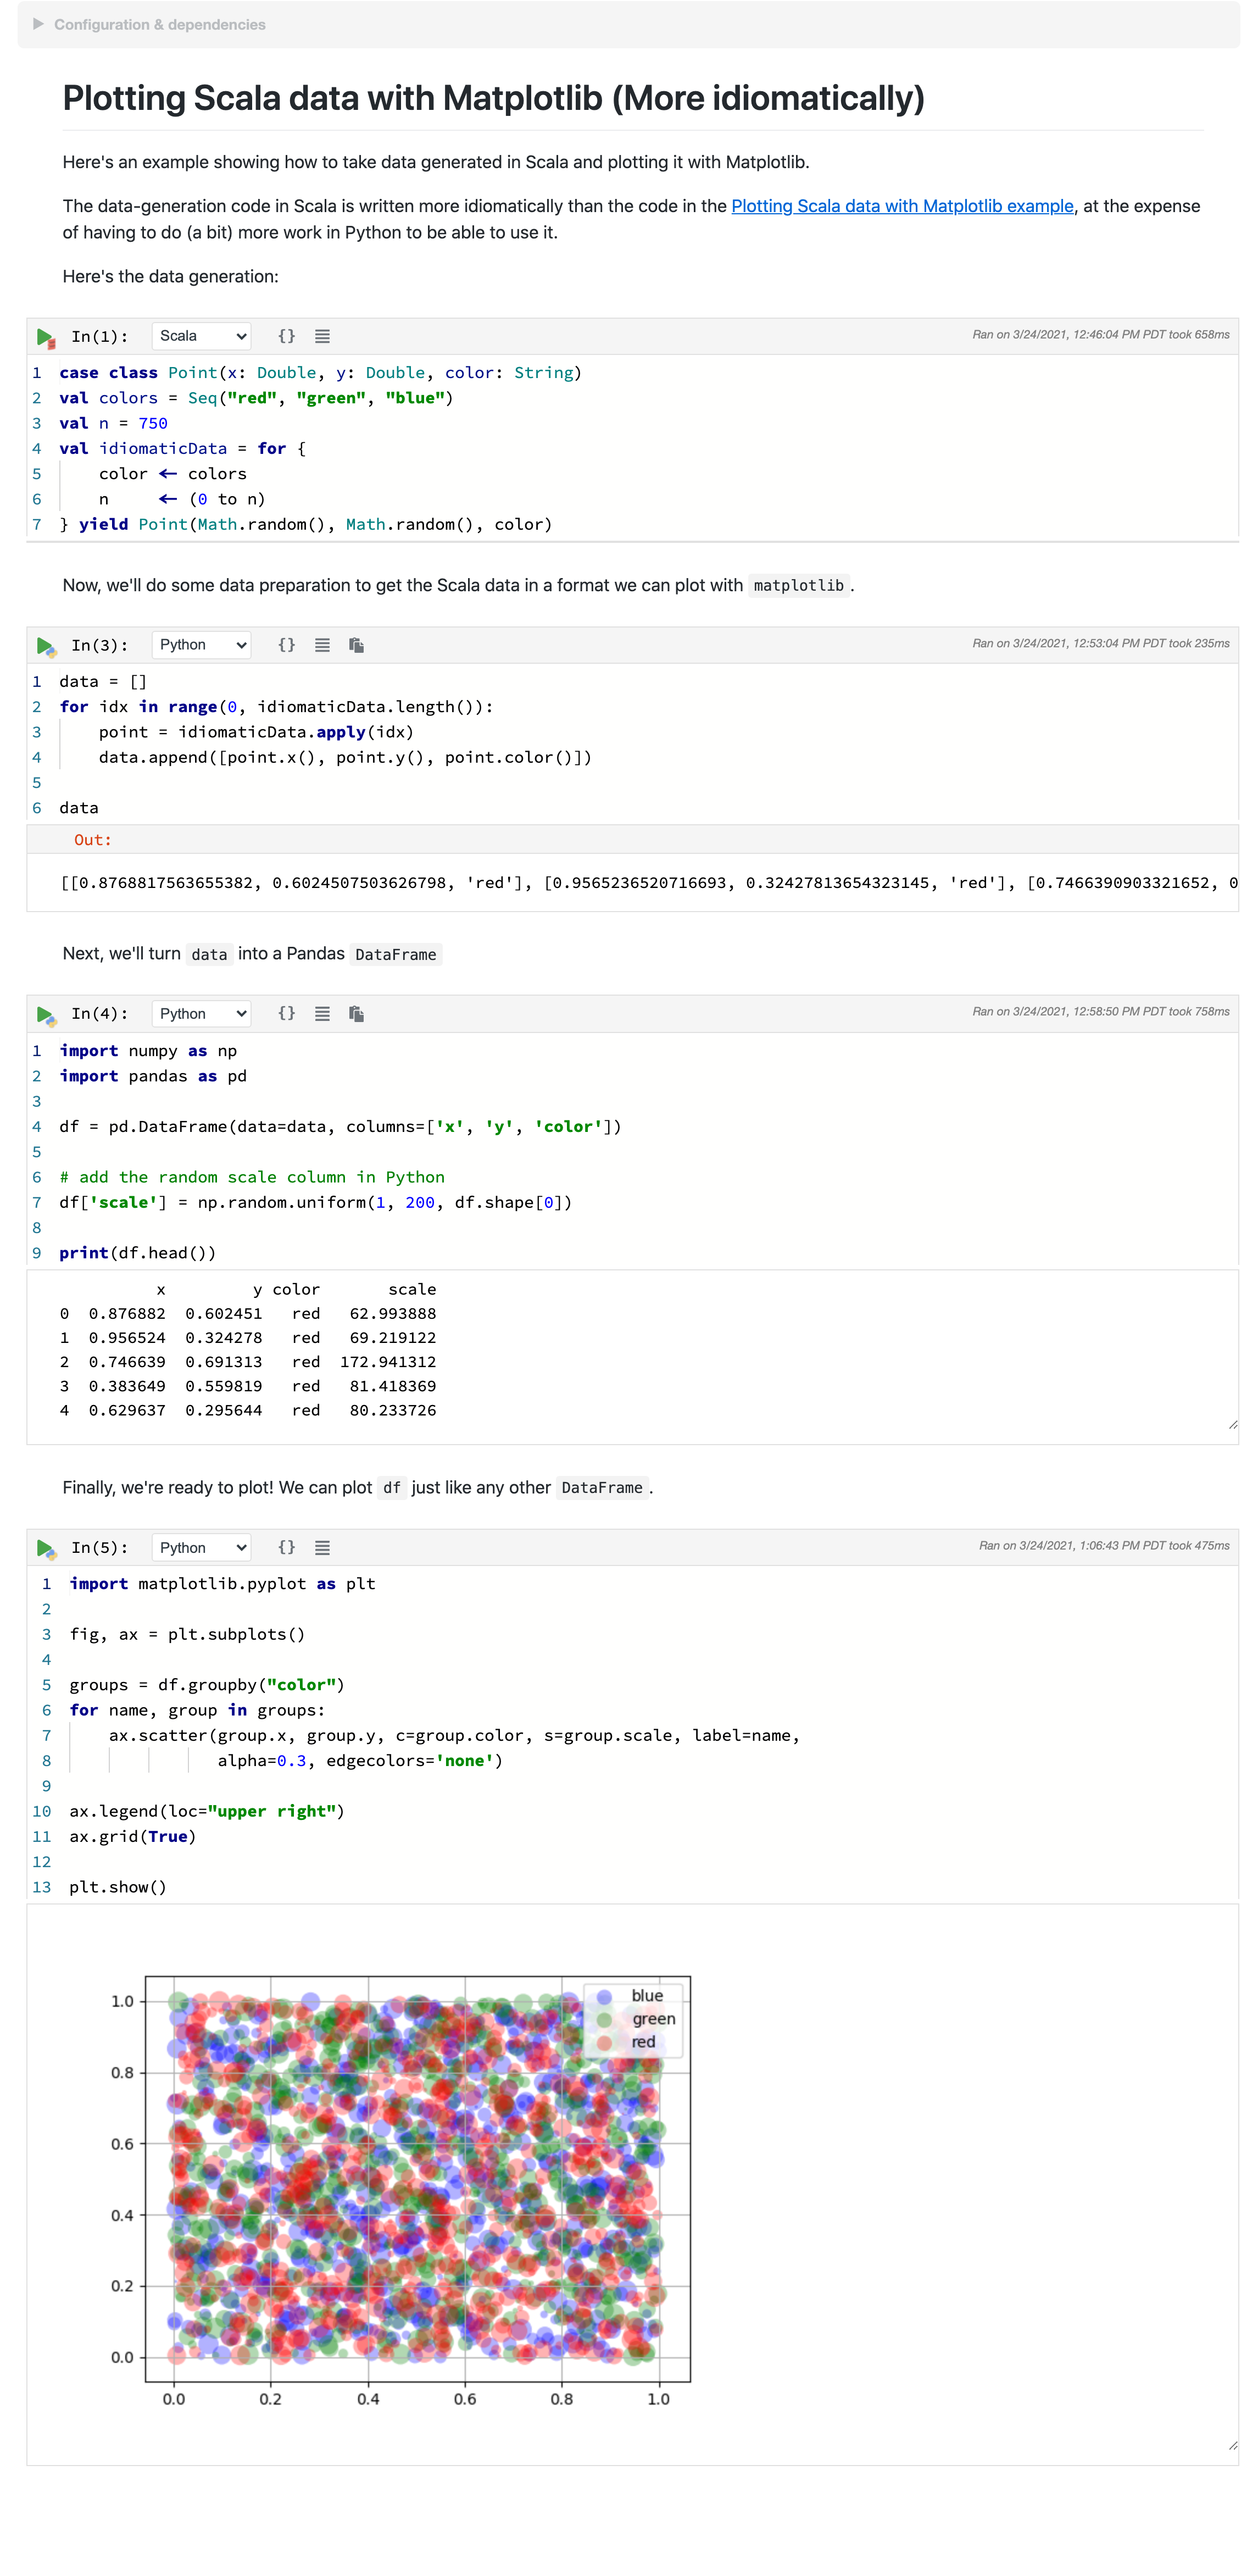
However, with a little Scala knowledge we can rewrite the plotting code to be more idiomatic, at the expense of having to do (a bit) more work in Python to massage the data.
A more idiomatic implementation
First, we'll use some more idiomatic code to generate our point data:
case class Point(x: Double, y: Double, color: String)
val colors = Seq("red", "green", "blue")
val n = 750
val idiomaticData = for {
    color <- colors
    n     <- (0 to n)
} yield Point(Math.random(), Math.random(), color)
Wow, a case class AND a for expression? This is surely extremely idiomatic Scala code.
Not an Array in sight!
Let's inspect idiomaticData for a moment.
Inspecting and Visualizing Data
This image showcases using the Quick Inspector and Viz cells to easily inspect values within a notebook.
Now that we've taken a look at idiomaticData and seen that it's a Seq[Point], we can delete the Viz cell and
start working with it using Python.
Since we're no longer working with primitives, we need to do a little data preparation. We'll build a list,
iterate over idiomaticData, and extract values from Point.
We want to end up with a simple 2D-Array we can use with matplotlib.
data = []
for idx in range(0, idiomaticData.length()):
    point = idiomaticData.apply(idx)
    data.append([point.x(), point.y(), point.color()])
There are two things of note here.
First, we need to manually iterate through the collection, generating an index which we can pass into the
apply(idx: Int): A
method of the Seq to select elements from it.
Second, we'll access the case class members using the member accessor methods as usual, but note that with
Python we need to specify (), as in point.x(), since of course in Python parentheses are always required,
even for nullary functions (ones that have no arguments).
At this point, the data variable is a nice list of lists, and we can easily turn it into a
Pandas DataFrame:
import pandas as pd

df = pd.DataFrame(data=data, columns=['x', 'y', 'color'])
Note that we have to manually specify the column names here. A more advanced example might extract the fields from
Point and pass them into Python, but we'll pass on that for now.
Now that our data is a Pandas DataFrame we can manipulate it as usual. For example, we can add a scale column to it:
import numpy as np

df['scale'] = np.random.uniform(1, 200, df.shape[0])
Finally, we can plot our DataFrame in the familiar way.
import matplotlib.pyplot as plt

fig, ax = plt.subplots()

groups = df.groupby("color")
for name, group in groups:
    ax.scatter(group.x, group.y, c=group.color, s=group.scale, label=name,
               alpha=0.3, edgecolors='none')

ax.legend(loc="upper right")
ax.grid(True)

plt.show()
That's it! This notebook can be found in the examples/ folder as well, in
Plotting Scala data with Matplotlib (Idiomatic).ipynb.
You can see a screenshot below.
Next, read about using Spark with Polynote.