Kernel Pane
The Kernel Pane displays information about the running state of the active notebook's kernel.
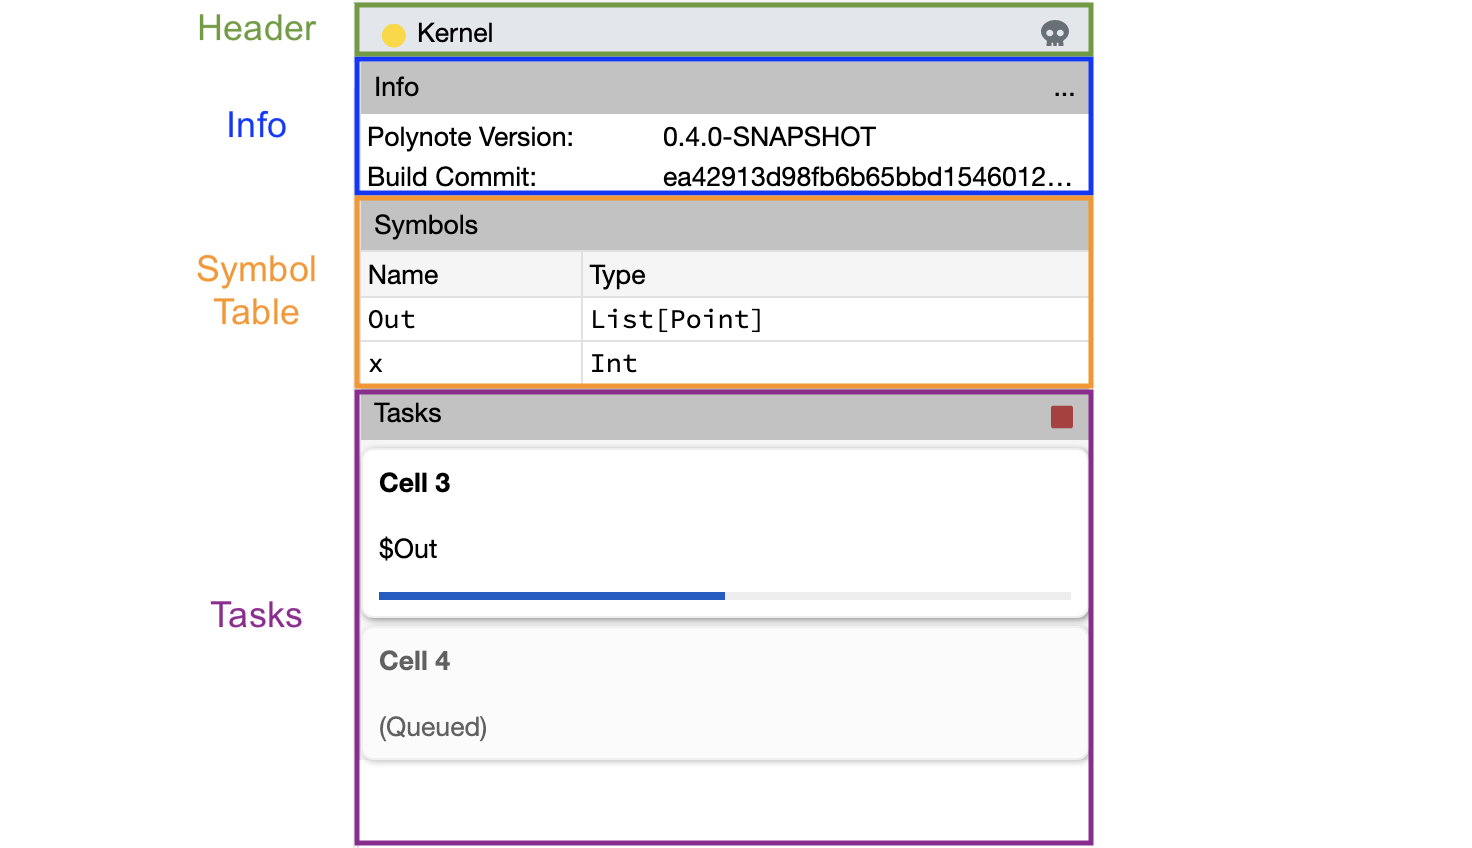
- The Header, which shows the current status of the kernel and controls for starting and stopping it.
- The Info section, which shows information about the current kernel.
- The Symbol Table, which shows the state of the kernel for the currently-selected cell.
- The Tasks section, which shows what the kernel is currently doing.
Header
The colored circle to the left of the header shows the status of the Kernel. Possible statuses are:
| Color | Meaning | Example |
|---|---|---|
| Gray | The client is disconnected from Polynote1 |
 |
| Red | The kernel is stopped: connected but not running |
 |
| Yellow | The kernel is busy executing something |
 |
| Green | The kernel is running and idle |
 |
- This means that the browser is unable to talk to the Polynote server. The server might be down, or there might be a connection issue between the browser and Polynote.
You might have also noticed that the symbol on the right side of the header changes depending on the kernel's status.
This symbol is a button that allows you to interact with the kernel:
| Button | State Available | Action |
|---|---|---|
 |
stopped |
Launch the kernel |
 |
busy, idle |
Kill the kernel |
 |
disconnected |
Attempt to reconnect to the server |
Info
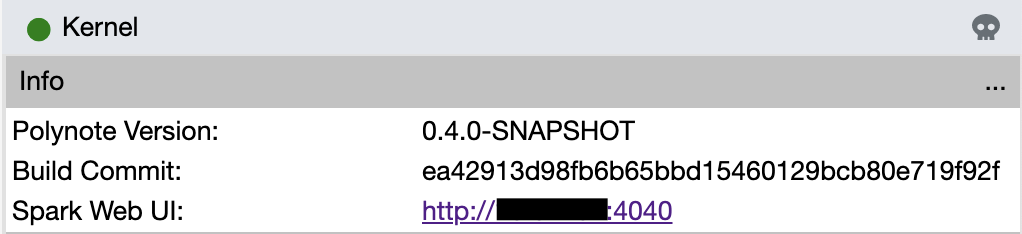
The Info section contains information about a currently running Kernel.
Currently, standard kernels simply display the current Polynote version, as well as the build commit.
Tip
Use the version and commit information when reporting issues to the Polynote team!
In addition to the above, Spark kernels show a link to the current Spark UI.
Symbol Table
The Symbol Table reveals the current state of the notebook, showing the input and output symbols of the currently selected cell (provided that the cell has been run).
See the Basic Usage section for a simple example of the symbol table.
The symbol table displayes the names and types of the available symbols. In order to see the value of the symbols and to inspect them further, you can hover over them to reveal the Quick Inspector.
Quick Inspector
In the above example, the selected cell has been run, so the symbols defined within are visible in the symbol table. Hovering over each symbol reveals the Quick Inspector.
For the data variable, a simple Seq[(String, String)], the Quick Inspector shows the entire toString()
value. However, as Out is a DataFrame, only the schema is shown as Polynote evaluates it lazily to prevent
collecting huge data unnecessarily.
Let's take a closer look at the Quick Inspector.
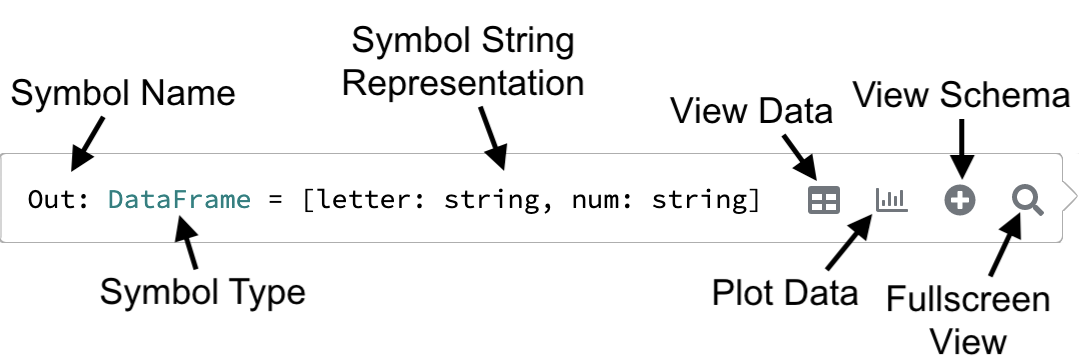
The first three buttons - View Data, View Schema, and Plot Data, each create a new
Viz Cell underneath the cell that defined the symbol, with the appropriate tab selected.
The last button, the magnifying glass, creates a modal that shows the available representations of the output.
Tasks
The Tasks section exposes information about what the kernel is doing: current and queued executions, as well as errors that might come up that are not associated with a particular cell.
Currently Running Tasks
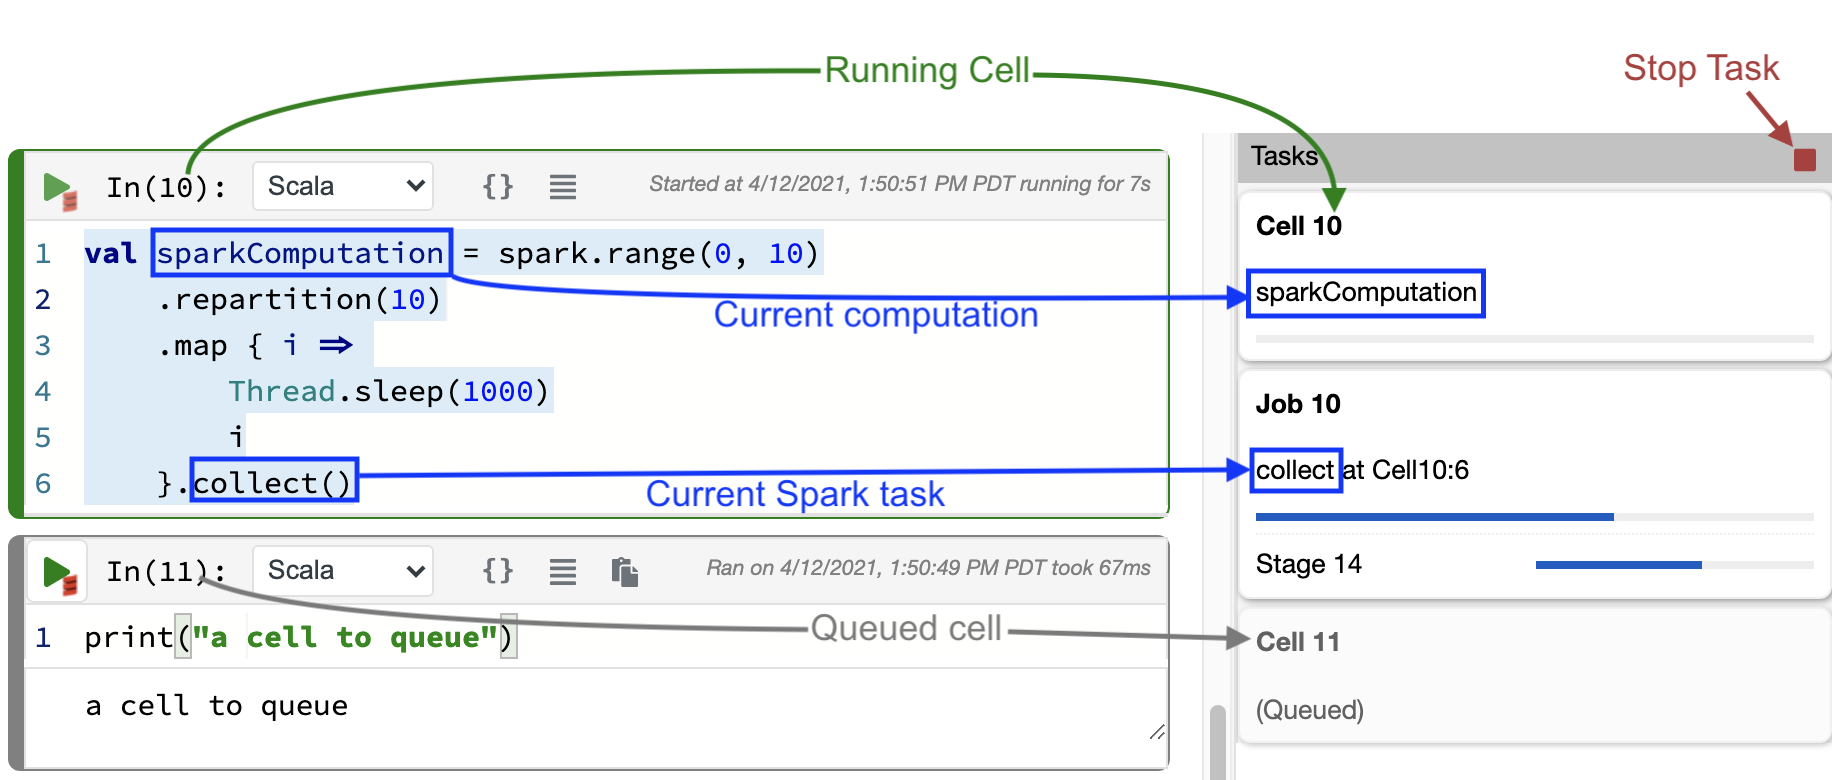
In the above example, a cell that contains Spark code is being executed, while the cell below it is queued up.
On the Tasks section, the current state of the execution is shown: the top task is labeled with the currently-running
cell's ID, as well as a label reflecting the statement being executed currently - in this case, the sparkComputation
variable being computed; in other cases a line number might be shown.
Since the execution is a Spark job, an additional task is shown, showing details of the Spark execution: the job number
and a label for the currently-executing stage (in this case, the call to collect()).
Finally, task is generated for the queued cell that will be executed after this one is finished. The tasks list always shows the order in which cells will be executed.
Tip
Note the Stop button on the top-right corner, which can be used to stop the currently-running task. It behaves like the other stop buttons in the UI; for more details, please see the advanced documentation.
Kernel or Server-level Errors
The Tasks section also provides a location to display error messages that don't belong to a specific cell. For example, you might see errors encountered during dependency resolution, or kernel crashes, or connection issues.